FROM 14 HOURS TO 100 MINUTES: Telemetry at Databricks Speed
Telemetry analytics rebuilt on Databricks: 8.6× faster, ~55% lower compute cost, 100% run success
United Consult rebuilt the Graphisoft's product-telemetry pipeline on Azure Databricks with Unity Catalog. Measured side-by-side against the legacy system on identical data: 8.6× faster end-to-end runs, ~55% lower compute cost per run, and a 100% success rate.
The Project
Every day, roughly 132,000 usage log files, 531 million product events, 132 GB of raw XML, arrive from Archicad. The pipeline that turned them into product analytics tables had grown organically into 55 mostly serial tasks across 173 notebooks (48,000 lines of code), with twelve near identical copies of the core parser, more than 4,000 lines of commented out code, and no automated tests. A fixed 10:00 UTC cron fired whether the data had arrived or not, and a single failure meant re running a 14 hour job. A median run took 12.5 hours, so analysts saw yesterday's data only by evening, and every change carried untestable risk.
The new pipeline is a 24 task medallion architecture (raw, cleaned, business ready layers) on Azure Databricks, governed by Unity Catalog. Delta Lake gives safe, repeatable re runs through partition scoped writes (MERGE and replaceWhere); the Photon engine on Databricks Runtime 17.3 (Spark 4) accelerates ten of eleven job clusters; a serverless arrival gate job launches the pipeline only once the day's data has arrived for every required product version; and Databricks system tables provide the DBU level cost evidence behind every number.
United Consult's team designed and delivered the transformation end to end, consolidating twelve duplicated parser notebooks into one parametrized notebook, replacing serial chains with a parallel task graph (the three dominant parser runs now execute concurrently in ~27 minutes instead of one 264 minute serial task), introducing 170 automated tests across 13 suites, and validating the whole system in a 2.5 month side by side production run against the legacy pipeline on identical data.

Technologies used





Technologies used
Technológia
Technologies used
Technologies used
Technologies used

the client
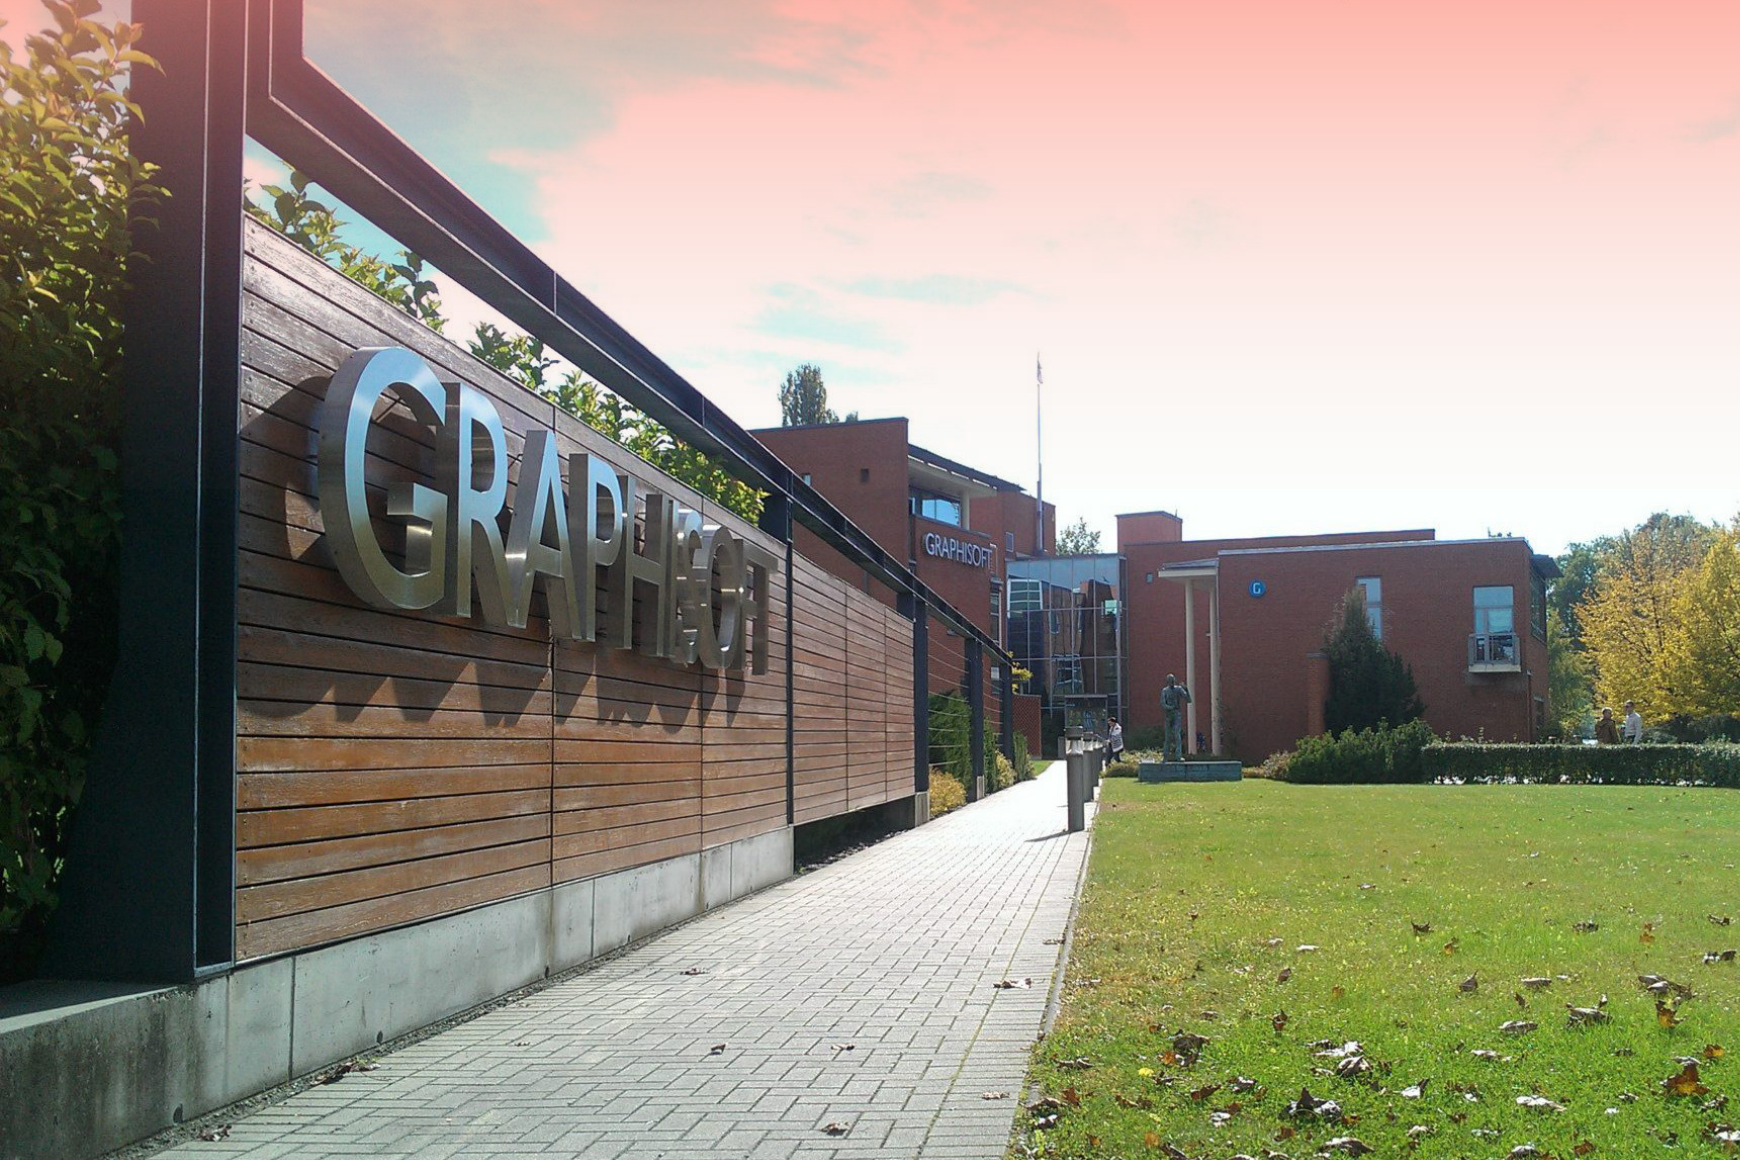
Graphisoft is a leading European developer of BIM (Building Information Modeling) software, best known for its flagship product, Archicad. The company's tools are used by architects and design professionals worldwide to plan, design, and document buildings throughout their entire lifecycle. Graphisoft's product telemetry spans roughly 132,000 usage log files and 531 million product events daily, reflecting the scale of its global user base. As part of the Nemetschek Group, Graphisoft continues to invest in cloud-based collaboration, open BIM standards, and data-driven product development to support architects working on increasingly complex projects.
Client
Industry
Region
Responsible for the project
Year of construction
Technology

challenges
The pipeline outgrew itself
Graphisoft's product telemetry had outgrown its own pipeline, not through neglect, but through growth. Every day ~132,000 usage log files (531M events, 132 GB of raw XML) arrive from Archicad. Over the years the pipeline had grown to 55 mostly serial tasks with 12 near identical parser copies.
Slower and more expensive with every run
A median 14.3 hour daily run, 17 hours on the worst day, meant analysts saw yesterday's data only in the evening, while compute cost per run rose month over month.
Rigid scheduling, fragile recovery
A fixed 10:00 UTC cron fired whether the data had arrived or not, and a single failure meant re running a 14 hour job.
Values for the customer
End-to-end design and delivery
United Consult's team independently designed and delivered the full transformation for Graphisoft, from architecture to consolidation to parallelization.
Quality and reliability built in
Quality and reliability built in. 170 automated tests across 13 suites, introduced where none existed, guarding the exact invariants that had caused past production incidents.
Proven, measured results
A 2.5 month side by side production validation against the legacy system on identical data, numbers backed by billing system tables and job telemetry, not estimates.

Project metrics
8.6×
Faster end to end runs. Median runtime dropped from 14.3 hours to 100 minutes, measured on identical data (last 10 runs of each pipeline).
~55%
Lower compute cost per run - 529 → 231 DBUs at current run-rate, with the gap widening monthly
100%
Run success rate - 32 of 32 runs completed since June 1, including one self-healing a transient task failure mid-run; automated testing went from 0 to 94 tests
Project metrics
8.6×
Faster end to end runs. Median runtime dropped from 14.3 hours to 100 minutes, measured on identical data (last 10 runs of each pipeline).
~55%
Lower compute cost per run - 529 → 231 DBUs at current run-rate, with the gap widening monthly
100%
Run success rate - 32 of 32 runs completed since June 1, including one self-healing a transient task failure mid-run; automated testing went from 0 to 94 tests
Projekt mérőszámai
8.6×
Faster end to end runs. Median runtime dropped from 14.3 hours to 100 minutes, measured on identical data (last 10 runs of each pipeline).
~55%
Lower compute cost per run - 529 → 231 DBUs at current run-rate, with the gap widening monthly
100%
Run success rate - 32 of 32 runs completed since June 1, including one self-healing a transient task failure mid-run; automated testing went from 0 to 94 tests
Project metrics
8.6×
Faster end to end runs. Median runtime dropped from 14.3 hours to 100 minutes, measured on identical data (last 10 runs of each pipeline).
~55%
Lower compute cost per run - 529 → 231 DBUs at current run-rate, with the gap widening monthly
100%
Run success rate - 32 of 32 runs completed since June 1, including one self-healing a transient task failure mid-run; automated testing went from 0 to 94 tests
Project metrics
8.6×
Faster end to end runs. Median runtime dropped from 14.3 hours to 100 minutes, measured on identical data (last 10 runs of each pipeline).
~55%
Lower compute cost per run - 529 → 231 DBUs at current run-rate, with the gap widening monthly
100%
Run success rate - 32 of 32 runs completed since June 1, including one self-healing a transient task failure mid-run; automated testing went from 0 to 94 tests
Project metrics
8.6×
Faster end to end runs. Median runtime dropped from 14.3 hours to 100 minutes, measured on identical data (last 10 runs of each pipeline).
~55%
Lower compute cost per run - 529 → 231 DBUs at current run-rate, with the gap widening monthly
100%
Run success rate - 32 of 32 runs completed since June 1, including one self-healing a transient task failure mid-run; automated testing went from 0 to 94 tests
results
Same-day, not next-day analytics
Fresh analytics now land about two hours after data arrival, instead of twelve-plus hours — giving analysts current-day data instead of yesterday's.
A supported, governed platform
The codebase moved from 173 untested notebooks to a modular, test-covered codebase deployed from git, running on a supported, governed foundation (Unity Catalog, DBR 17.3) with full cost observability.

lépj kapcsolatba velünk


Iratkozz fel hírlevelünkre!
Csak értékes tartalom, semmi spam. Csatlakozz IT közösségünkhöz!
© 2026 United Consult Zrt.



get in touch
Subscribe to our newsletter!
We are an innovative community who are stick together and belive in development.
© 2026 United Consult Zrt.

Lépj kapcsolatba velünk
Iratkozz fel hírlevelünkre!
Csak értékes tartalom, semmi spam. Csatlakozz IT közösségünkhöz!
© 2026 United Consult Zrt.
lépj kapcsolatba velünk
Iratkozz fel hírlevelünkre!
Csak értékes tartalom, semmi spam. Csatlakozz IT közösségünkhöz!
© 2026 United Consult Zrt.
lépj kapcsolatba velünk
Iratkozz fel hírlevelünkre!
Csak értékes tartalom, semmi spam. Csatlakozz IT közösségünkhöz!
© 2026 United Consult Zrt.
get in touch
Subscribe to our newsletter!
Only valuable content, no spam. Join our IT community!
© 2026 United Consult Zrt.